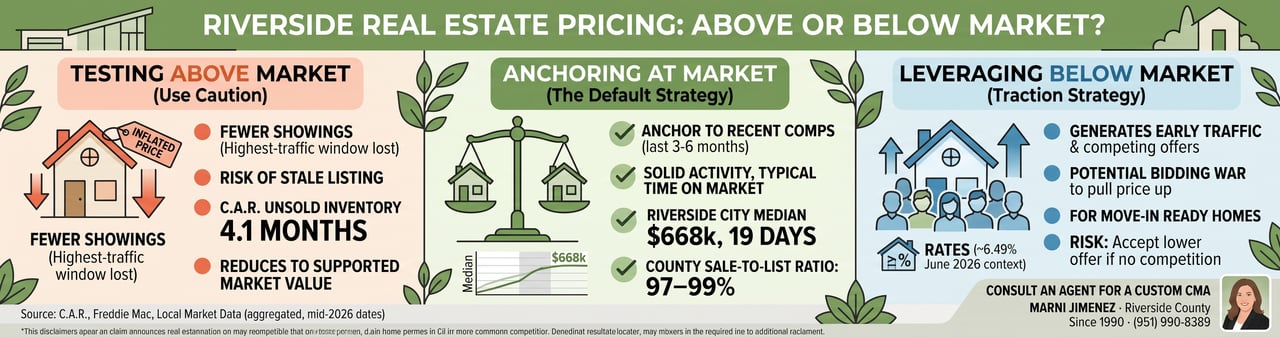
Should you price above or below market in Riverside right now?
In Riverside's current balanced market, the data points to one clear default: price at or very near recent comps. Sale-to-list price ratios are running between 97% and 99%, meaning buyers and sellers are meeting close to the middle on almost every transaction. Sellers who test significantly above market tend to sit longer, accumulate days on market, and eventually reduce, often landing at the price they could have started at. A below-market strategy can work, but only under the right conditions.
Key Takeaways
- Riverside County's sale-to-list price ratio is approximately 97–99% in mid-2026, so most homes close within 1–3% of their list price.
- The median sale price in the city of Riverside is $668,000 over the most recent 90-day period, with homes selling in a median of 19 days, faster than the broader county.
- Riverside County's unsold inventory index sits near 4.1 months, a near-balanced market where overpricing carries real risk of extended days on market.
- Pricing below market can generate multiple offers and pull the final price back up, but only works reliably when the home is move-in ready and inventory in that price band is thin.
- The first two weeks after listing are the highest-traffic window, a mispriced home loses that momentum and rarely fully recovers it.
What does the Riverside pricing data actually tell sellers?
The most important number a Riverside seller should understand before setting a list price is the sale-to-list ratio. It tells you how much of a cushion, or gap, actually exists between what sellers ask and what buyers pay.
According to the California Association of REALTORS®, the Riverside County median sold price was approximately $640,000 in May 2026 and $635,000 in June 2026, essentially flat year-over-year. A county-level market report for June 2026 puts the sale-to-list ratio at about 97.1%, up slightly from 96.9% a year earlier. A separate data aggregation that draws on Freddie Mac and other sources puts the ratio even tighter, near 98.8% for some datasets.
What that means in plain terms: the average Riverside County seller is closing within 1–3% of their list price. There is no broad wave of buyers paying 5% or 10% over asking. There is also no broad wave of sellers needing to slash prices by 10%. The market is sitting in a narrow band.
For pricing strategy, that narrow band is everything. It tells you that your list price is essentially your negotiating anchor, and that anchor needs to be set correctly from day one.
How does Riverside city compare to the rest of the county?
The city of Riverside is outperforming the broader county right now. Recent local market data shows a median sale price of $668,000 and a median of just 19 days on market over the most recent 90-day period. That is meaningfully faster than the county-wide median of roughly 47–53 days.
Here is how Riverside stacks up against other areas I work in across Riverside County:
Area | Median Sale Price | Median Days on Market |
|---|---|---|
Riverside | $668,000 | 19 |
Moreno Valley | $558,495 | 23 |
Corona | $727,144 | 30 |
Norco | $910,000 | 41 |
Perris | $581,763 | 47 |
Source: recent local market data, aggregated public listing data, trailing approximately 90 days as of September 2026. Individual home values vary by condition, street, build year, and timing.
The takeaway: if you are selling in Riverside city, you are in a faster sub-market than the county average suggests. That does not mean you can price freely above comps, but it does mean a well-priced home here moves. Perris and Norco, by contrast, are slower, and the pricing strategy there needs to account for that longer absorption window.
If you want to know exactly where your home sits within this picture, a current market analysis for your specific property is the only way to get a reliable answer.
Above market, at market, or below market, what each strategy actually does
Pricing above market: when it works and when it backfires
Pricing above recent comps is not automatically wrong. It can make sense when your home has features that are genuinely scarce locally, a large usable lot, an ADU, a panoramic view, or a location in one of Riverside's walkable historic pockets. It can also make sense when competing inventory in your specific price band is thin, even if overall county inventory is sitting near 4.1 months of supply.
But the conditions have to be right. According to C.A.R., the county's unsold inventory index is around 4.0–4.1 months. That is a near-balanced market. Realtor.com's June and July 2026 regional analysis shows the Inland Empire's median days on market running around 59 days, several days longer than the national median of 53. Buyers here are not in a panic. They are taking their time, comparing options, and resisting overpriced listings.
When a home is priced 5–10% above what recent comps support, here is what typically happens in a market like this:
- Fewer showings in the first two weeks, because buyers' agents are filtering by price against the comp set.
- Lower-quality offers when they do come, more contingencies, more concession requests.
- A price reduction that moves the home back toward where it could have started, but now with accumulated days on market that signal to buyers that something is wrong.
I have watched this play out more times than I can count over 35 years in Riverside County. The first two weeks after a listing goes live are the highest-traffic window you will ever have. A mispriced home burns that window and rarely fully recovers it.
The one caveat: the city of Riverside has shown about 3.1% year-over-year price growth in recent data, while the broader county has flattened. In certain high-demand pockets of Riverside city, a mild test above comps, we are talking 2–3%, not 8–10%, might be defensible if the property genuinely stands out. That is a conversation I have with each seller individually, because it depends on the specific street and comp set, not just the headline median.
Pricing at market: the default strategy in mid-2026 Riverside
With sale-to-list ratios between 97% and 99%, pricing at market means anchoring your list price to what similar homes in your micro-area have actually closed for in the last three to six months, adjusted for condition, updates, and any features that genuinely differentiate your home.
This is not the same as chasing the county median. The C.A.R. county median of roughly $600,000–$640,000 is an average across thousands of transactions. Your comp set is the five to ten homes most similar to yours, in your neighborhood, that closed recently. Those are the numbers that matter.
When a Riverside seller prices in line with that tight comp set, the data supports a reasonable outcome: solid activity within the typical 45–55 day window at the county level, or faster if you are in the city of Riverside's 19-day median territory. You are not leaving money on the table, and you are not risking a stale listing.
This is exactly the kind of analysis I walk every seller through before we set a number. If you want to see what that looks like for your home, start with an honest look at what your home is worth right now.
Pricing below market: a traction strategy with real trade-offs
A below-market list price is not a sign of desperation, it is a deliberate strategy to generate early traffic and, ideally, competing offers that pull the final price back up toward or slightly above where you started.
In a balanced market with moderate inventory, this can work. The logic: buyers who have been watching the market will recognize the value immediately, schedule showings fast, and potentially create a multiple-offer situation in the first week. When that happens, the final sale price often lands at or above what a market-rate listing would have achieved, with less time on market and less negotiating friction.
The trade-offs are real, though:
- If the bidding war does not materialize, because inventory in your price band is not actually as thin as you thought, or because the home has condition issues that scare off multiple buyers, you may end up accepting a below-market offer.
- This strategy works best on move-in-ready homes. A property with deferred maintenance or dated finishes may not attract the competitive interest needed to push the price back up.
- Mortgage rates are still elevated. Freddie Mac's Primary Mortgage Market Survey put 30-year fixed rates around 6.49% in late June 2026, down from about 6.77% a year earlier. Monthly payments remain high by pre-2022 standards, which means buyers are payment-sensitive. A below-market price that keeps the home in a competitive payment bracket can be genuinely compelling.
I only recommend this strategy when the numbers and the home's condition support it. Your situation depends on your timeline, your equity position, and what the competition in your specific price band looks like at the moment you list.
What signals I watch after a listing goes live
Pricing is not a one-time decision. Once a home is on the market, I watch a short list of signals in the first two weeks to know whether the strategy is working:
- Showing count relative to comparable active listings nearby. If similar homes are getting more traffic, the price needs attention.
- Online engagement, views and saves compared to other Riverside listings in the same price band. Low engagement in week one is an early warning sign.
- Nearby homes going under contract, how quickly and at what relationship to their list price. If comparable homes are closing fast and you are not getting offers, the gap is almost always price.
If those signals are weak, the standard playbook is a strategic price adjustment toward the current comp range before the home crosses the local median days on market. At that point, the listing starts to look stale to buyers who are watching the market closely, and they are. Occasionally, improving presentation (staging, professional photography, minor repairs) can help alongside or instead of a price change, but in most cases, the market is telling you something specific about price.
The 2026 Riverside housing market rewards sellers who stay nimble and read those signals early.
Frequently Asked Questions
How close are Riverside sale prices to list prices right now?
Very close. County-level data for mid-2026 puts the sale-to-list ratio between 97% and 99%, meaning the typical Riverside home closes within 1–3% of its list price. That narrow gap is the single most important reason to set your list price accurately from day one, there is not much room to negotiate down from an inflated starting point without triggering buyer skepticism.
What happens if I price my Riverside house above what recent comps support?
You risk burning your best window. The first two weeks after listing generate the most buyer interest, and an above-market price filters out the most qualified buyers before they ever schedule a showing. Homes that overprice in Riverside's current balanced market tend to accumulate days on market, then reduce to roughly where they should have started, but now with a visible price history that signals to buyers that something was wrong. The California Association of REALTORS® data for Riverside County shows a median days on market in the high 40s to low 50s at the county level; overpriced homes consistently run longer than that median.
Is it smarter to price my Riverside home a little below market to get more offers?
It can be, but only under the right conditions. A below-market list price works best when your home is move-in ready, inventory in your specific price band is limited, and you are prepared for the possibility that the expected competing offers may not materialize. When it works, the final sale price often ends up at or above a market-rate list price with less time on market. When it does not work, you may end up accepting an offer below what you could have achieved. This is a strategy I evaluate case by case, not a blanket recommendation.
Are buyers in Riverside still paying over asking, or mostly at or under list?
Mostly at or slightly under list, in aggregate. With sale-to-list ratios running 97–99%, the typical closed transaction is just 1–3% below the list price. Some well-priced, move-in-ready homes in high-demand pockets of Riverside city do receive offers at or slightly over list, particularly given the city's recent 3.1% year-over-year price growth, but that is the exception, not the rule across the broader county market.
How long are homes in Riverside taking to sell in 2026 if they're priced at market?
Within the city of Riverside, recent local market data shows a median of 19 days on market over the last 90-day period. At the county level, the median sits in the high 40s to low 50s depending on the dataset. A home priced accurately at market value in a desirable Riverside neighborhood should see meaningful activity within the first two weeks; if it does not, that is a signal the price needs a second look. According to Realtor.com's regional analysis, the Inland Empire's days on market are running slightly longer than the national median of 53 days, which reinforces the importance of competitive pricing from the start.
How do mortgage rates affect whether I should price above or below market in Riverside?
Rates matter because they directly affect what buyers can afford monthly, not just what they can borrow. With 30-year fixed rates around 6.49% as of late June 2026, payments on a $668,000 home are still meaningfully higher than they were in 2020 or 2021. That payment sensitivity makes buyers resistant to above-market pricing, they are calculating monthly cost, not just comparing to the list price. Slightly easing rates have supported steady demand, as reflected in Riverside County's 7–10% sales volume increase in June 2026, but buyers will still walk away from a home that feels overpriced relative to what their payment will be.
If you are weighing a pricing decision for your Riverside home, I am happy to walk you through the current comp set and help you think through which strategy fits your goals and timeline. You can read what past clients have said about working with me on Google or Zillow.
Pricing a home in Riverside right now is not a guessing game, the data is clear about what works and what backfires. The question is how it applies to your specific home, your street, and your timeline. Reach out and let's run the numbers together.
Equal Housing Opportunity. This article is general information only and is not legal, tax, or financial advice. Confirm your specific numbers with your escrow officer, tax advisor, or lender before making any transaction decisions.